Data and study design
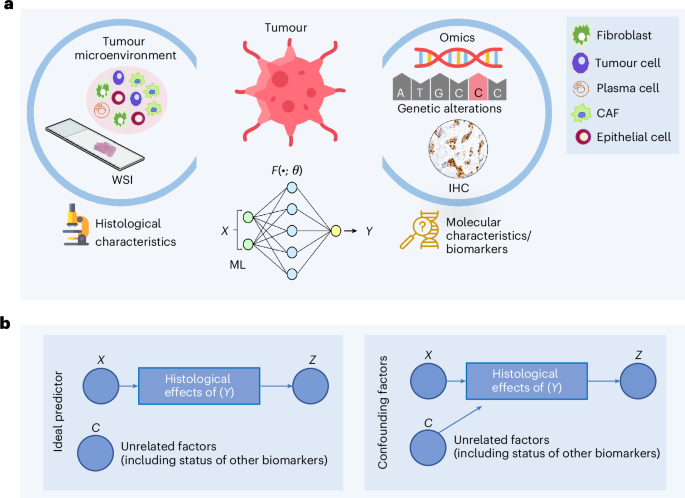
We analysed the limitations of existing ML approaches for predicting molecular biomarkers (for example, mutations, genomic instability indicators and protein expression) from H&E stained WSIs. A high-level concept diagram of these approaches is provided in Fig. 1. We hypothesize that interdependencies among biomarker statuses and clinicopathological variables in the training data, and the disregard of such associations during model development, bias ML models towards relying on aggregated influences of multiple factors in WSIs rather than patterns linked to individual biomarkers. To illustrate this, we retrospectively analysed n = 8,221 patients with breast cancer (BRCA), colorectal cancer (CRC), endometrial cancer (UCEC) and lung cancer across four cohorts for which WSIs and/or molecular information (for example, receptor status, gene mutations and so on) were available (Methods). These include: TCGA (n = 2,683), Molecular Taxonomy of Breast Cancer International Consortium (METABRIC; n = 2,433)24,25, Memorial Sloan Kettering Cancer Centre (MSK; n = 2,486)26,27 and DFCI (n = 619)28. Using these datasets, we performed the four major steps listed below:
-
(1)
An analysis of the interdependency among biomarkers and somatic mutation status of genes in samples;
-
(2)
Training deep learning models to predict biomarker status from WSIs;
-
(3)
Stratification analysis and permutation testing to assess whether the model trained to predict a certain biomarker is biased by the status of other biomarkers or clinicopathological variables;
-
(4)
An analysis of the added value of using ML models in predicting various biomarkers over and above the pathologist-assigned grade.
a, The ML-based prediction of molecular biomarkers from WSIs involves using training data of WSIs with known biomarker statuses. The ML model accepts the representation of a WSI (\(X\)) as input and predicts the status of a certain biomarker (\(Y\)) as the target. b, An ideal predictor should be able to predict the status of a molecular biomarker from histological effects of that biomarker contained in the WSI, and its output (Z) should be independent of unrelated confounding factors (lumped into a variable C) as shown in the simplified causal diagram. Conversely, if the predictor’s output is dependent not only on the histological effects of \(\left(Y\right)\) but also on other confounding factors (for example, histological grade, TMB or status of other biomarkers), then the prediction is confounded because the model is relying on these additional covariates rather than solely on the effects of \((Y)\). Credit: icons in a, Flaticon.com.
Drawing from established methods in gene functional analysis20,21,29,30,31, we quantified the interdependency among molecular factor labels across patients by evaluating their pattern of co-occurrence and mutual exclusivity. We used log odds ratios (LOR) to quantify these relationships, where positive LOR values indicate co-occurrence, and negative values indicate mutual exclusivity. Statistical significance was assessed with a two-sided Fisher’s exact test, and the resulting P values were corrected for multiple hypothesis testing.
To assess whether biomarker interdependencies introduce bias into WSI-based models, we analysed three deep learning algorithms with different principles of operation: attention-based (CLAM32), graph neural network-based (\({\mathrm{SlideGraph}}^{\infty }\)33) and a WSI-level multimodal foundation model (TITAN22). These algorithms represent existing ML approaches that do not explicitly consider interdependencies between prediction variables. As CLAM and \({\mathrm{SlideGraph}}^{\infty }\) rely on a patch-level encoder, we trained them with two different encoders: CTransPath34 (trained on histology images) and ShuffleNet35 (trained on ImageNet)36 to minimize encoder-specific bias. For each biomarker, we train these models with both encoders on the TCGA cohort using fourfold cross-validation and report AUROC as a performance metric. We further evaluated the trained models on two independent validation cohorts, CPTAC37 and the Australian Breast Cancer Tissue Bank (ABCTB)38. Finally, we used WSI-level representation from a multimodal foundation model (TITAN)22, trained on 330,000 image–text pairs, under the hypothesis that these embeddings better capture biomarker-related morphology, and trained both single-output and multi-output biomarker predictors on them.
To investigate whether WSI-based biomarker prediction models are confounded by the interdependency among molecular factors or clinicopathological variables (for example, histological grade or TMB), we performed a stratification analysis and permutation testing. For each model, we define two types of variable: the prediction variable, which is the biomarker the model is trained to predict, and stratification variables, which are biomarkers or clinicopathological features showing significant mutual exclusivity or co-occurrence with the prediction variable and may act as confounders (identified in step 1). The motivation for considering interdependent variables as confounders is that they may be associated with a shared phenotypic pattern in WSIs, which the model can exploit as proxies for the prediction variable, potentially leading to biased predictions when such signals are absent or decoupled at test time. To detect such confounders, we evaluate model performance at two levels: (1) across the entire cohort and (2) within subgroups defined by stratification variables. Examining model performance within these subgroups allows us to isolate the effect of the prediction variable from confounders. If the model truly captures prediction variable specific patterns in WSIs, its subgroup-level performance should closely match the cohort-level performance. By contrast, substantial differences between subgroups and overall performance indicate the influence of confounding effects or Simpson’s paradox39,40. To quantify these effects, we perform permutation testing and report their statistical significance.
For example, to evaluate whether the performance of a WSI-based predictor for oestrogen receptor (ER) status (prediction variable) is influenced by TP53 mutation status (stratification variable), we first divide the cohort into two subgroups on the basis of the stratification variable: patients with a TP53-mutant status and patients with a TP53 wild-type status. We then compute the AUROC of the ER predictor within each of these subgroups. Finally, we compare these subgroup-level AUROCs to the model’s overall AUROC across the entire cohort. A substantial difference between subgroup and cohort-level AUROCs indicates a potential bias, suggesting the model captures the combined effects of ER and TP53 rather than ER-specific features alone. To establish statistical significance, we run a permutation test with 10,000 trials (see Methods for more details). This definition of the ‘prediction variable’ (ER status in this example) and the ‘stratification variable’ (TP53 status in this example) will be used consistently in subsequent results and figures to ensure clarity. Repeating this across alternative stratification variables (for example, grade and TMB) provides a systematic way of detecting the influence of confounding factors on different WSI-based models.
To assess the added value of ML models in predicting various biomarkers over and above pathologist-assigned grades, we used a support vector machine with one-hot encoded histological grades to predict various clinical biomarkers following the same protocols used for weakly supervised models.
Biomarker statuses show significant interdependencies and variations
Our analysis revealed significant interdependencies (\(P\ll 0.05\)) among biomarkers across cancer types (Fig. 2 and Supplementary Fig. 1). In BRCA, elevated ER and progesterone receptor (PR) expression co-occur with mutations in CDH1, MAP3K1 and PIK3CA, but not with TP53, which is mutually exclusive with CDH1, GATA3, MAP3K1 and PIK3CA41. In CRC, MSI-high (MSI-H) cases frequently carry BRAF, ATM, ARID1A and RNF43 mutations and are less likely to harbour KRAS mutations; BRAF-mutant tumours also show higher TMB and show co-occurrence with ATM, RNF43 and ARID1A. Similar patterns of interdependencies are also observed in UCEC and lung adenocarcinoma (LUAD) (Supplementary Fig. 1). For instance, in UCEC, PTEN mutations co-occur with APC, ATM, JAK1, KRAS and ARIDA, whereas in LUAD, STK11 mutations co-occur with KEAP1 but rarely with EGFR.
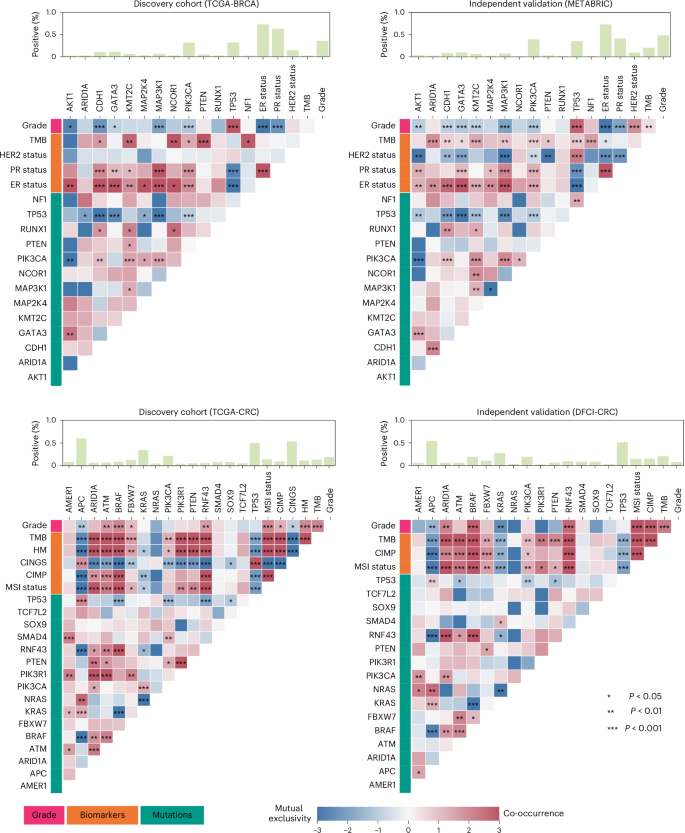
The heat maps display a set of biomarkers and genes along the axes, with cell colours within the heat map showing the strength of association (dark red colours for co-occurrence and dark blue for mutual exclusivity). Cells marked with asterisks indicate statistically significant associations (Benjamini–Hochberg FDR-corrected P values from two-sided Fisher’s exact test \(P\ll 0.05\)). The top bar above each heat map shows the percentage of cases mutated for a specific gene in case of gene mutations, whereas for biomarkers, it indicates the percentage of patients with elevated ER, PR and HER2 in case of breast tumours, high MSI, hypermutation and CIMP activity and CIN for colorectal tumours. CINGS, chromosomally instable versus genome stable; HM, hypermutated.
Our analysis further showed that, within the same tissue type, biomarker associations can vary across datasets, showing sampling variations. In the TCGA-BRCA cohort, MAP3K1 mutations showed mutual exclusivity with AKT1 and ARID1A, whereas in the METABRIC cohort, they showed a tendency towards co-occurrence (Fig. 2). ER status and high TMB showed mild co-occurrence in the TCGA-BRCA cohort but mutual exclusivity in the METABRIC cohort. In the TCGA-CRC cohort, BRAF-mutant tumours were significantly less likely to harbour TP53 mutations, whereas this association is less pronounced in the DFCI cohort and lacks statistical significance. Similar cross-dataset differences were observed in UCEC and LUAD (Supplementary Fig. 1). For instance, in TCGA-LUAD, BRAF and STK11 showed a weak tendency towards mutual exclusivity, whereas in the MSK cohort, they showed a weak tendency towards co-occurrence.
These results show that biomarker statuses are significantly interdependent and that their association patterns can vary across datasets. Consequently, ML models trained on WSIs may learn composite phenotypes driven by multiple interdependent biomarkers, introducing cohort-specific biases and limiting their generalizability to unseen cases.
Prediction of biomarkers and gene alterations from WSIs
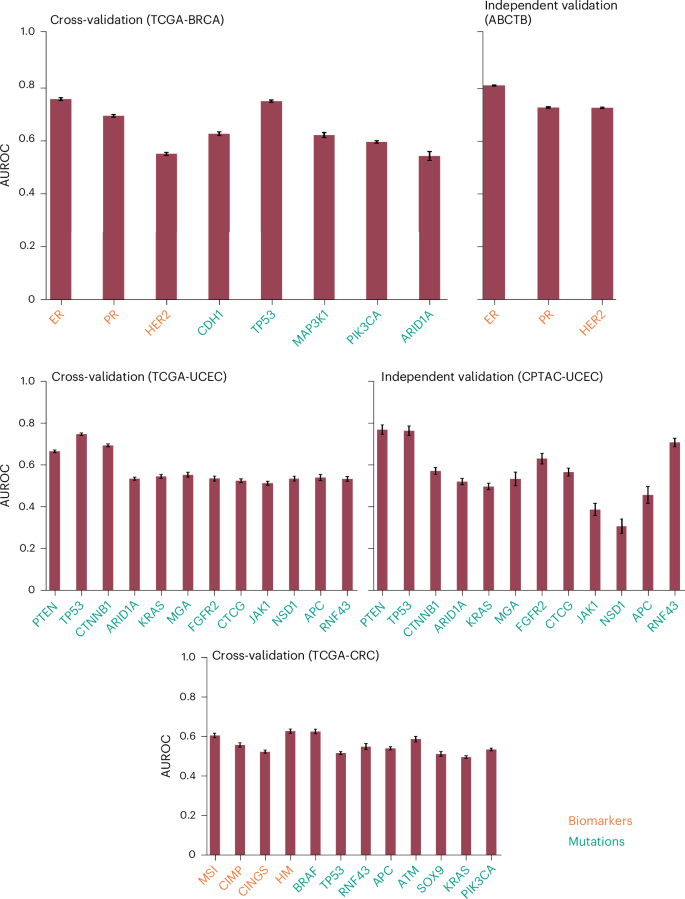
To demonstrate that the ML models analysed in the study were properly trained, we report biomarker prediction performance across algorithms, feature embeddings and modelling approaches (Fig. 3 and Supplementary Figs. 1 and 2). Different model configurations achieved AUROCs >0.80 for multiple biomarkers in both cross-validation and independent validation cohorts.
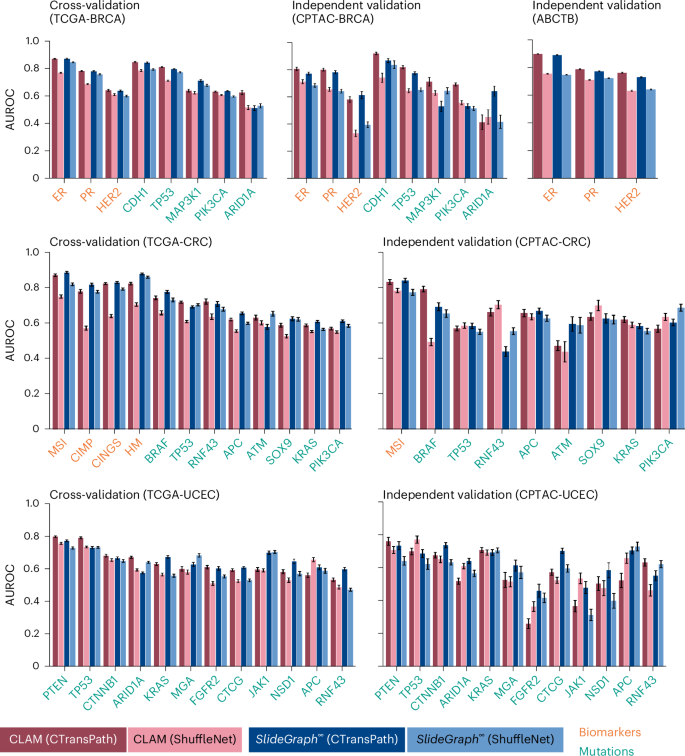
The plots show the AUROC for two weakly supervised models (CLAM and \({\mathrm{SlideGraph}}^{\infty }\)), each trained with two different patch-level encoders: ShuffleNet, a convolutional neural network-based encoder pretrained on natural images, and CTransPath, a transformer-based model pretrained on WSIs through self-supervised learning. For each biomarker or gene mutation, the comparative predictive performance for these four model-encoder combinations is shown. Dark and light red bars correspond to CLAM with CTransPath and ShuffleNet, respectively, whereas dark and light blue bars correspond to \({\mathrm{SlideGraph}}^{\infty }\) with CTransPath and ShuffleNet, respectively. Bar heights represent mean AUROC values, whereas error bars indicate the 95% confidence (two-sided, using Student’s t-distribution) calculated across 100 class-stratified bootstrap sampling runs. Bar labels are colour-coded, with yellow denoting biomarkers and green denoting mutations.
In BRCA, CLAM with CTransPath features predicts receptor status with average AUROCs of 0.87 and 0.90 for ER and 0.79 and 0.78 for PR, in cross-validation (TCGA-BRCA) and independent validation (ABCTB) cohorts, respectively. Similar AUROCs were observed for \({\mathrm{SlideGraph}}^{\infty }\) (CTransPath). These models also inferred gene mutations with high accuracy; for example, CLAM (CTransPath) predicted CDH1 and TP53 mutations with AUROCs of 0.88 and 0.82 in TCGA-BRCA and 0.91 and 0.82 in CPTAC-BRCA, respectively.
Beyond breast tumours, these models also achieved high AUROC values for predicting biomarkers and gene mutations in CRC, lung cancer and UCEC (Fig. 3 and Supplementary Fig. 2). For instance, \({\mathrm{SlideGraph}}^{\infty }\) (CTransPath) predicted MSI status in CRC with an AUROC of 0.89 in TCGA-CRC (cross-validation) and 0.84 in CPTAC-CRC (independent validation). A strong predictive performance was also observed for other biomarkers, including BRAF, CpG island methylator phenotype pathway (CIMP), CINGS and hypermutation status (Fig. 3).
Apart from weakly supervised approaches, single-output and multi-output models trained on TITAN WSI-level feature representation showed roughly similar performance (Supplementary Fig. 3). For example, the multi-output model predicts the ER and PR status of TCGA-BRCA cases with an AUROC of 0.89 and 0.81, respectively, closely matching the AUROC values of models trained under the single-output setting (ER 0.89 and PR 0.79).
These results confirm the proper training of these models. Next, on the basis of AUROC, we selected the best model for each biomarker and assessed the influence of biomarker interdependencies through permutation testing and stratification analysis.
Interdependence in biomarker status leads to entangled histology phenotypes captured from WSIs
Our confounding factor analysis reveals that WSI-based predictors are strongly influenced by biomarker interdependencies. Across multiple biomarkers, the higher cohort-level AUROCs achieved by these models drop substantially in subgroups defined by the statuses of various stratification variables (Fig. 4 and Supplementary Figs. 4–7). For example, \({\mathrm{SlideGraph}}^{\infty }\) predicts colorectal tumours’ MSI status (the ‘prediction variable’) with an AUROC of 0.88 (0.873–0.886). However, when the same patient set is divided into hypermutated and non-hypermutated subgroups (the ‘stratification variable’), the AUROC for MSI status prediction drops to 0.72 within each subgroup. A similar effect is observed in stratification by other biomarkers showing co-occurrence with MSI (for example, CIMP activity, hypermutation and APC statuses) and those showing mutual exclusivity (for example, BRAF and CINGS) (Fig. 4).
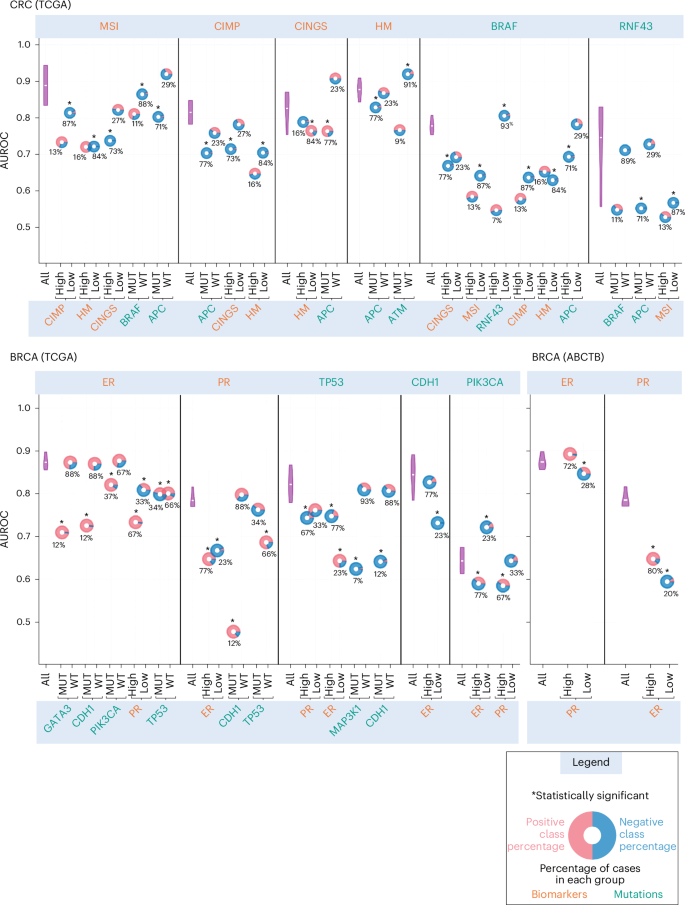
AUROC values are illustrated on the y axis, with the top x axis indicating the prediction variables and the bottom x axis showing the stratification variables. The predictive performance of each predictor on all the cases in the cohort (denoted by ‘All’ in the plot) over 100 bootstrap runs is shown using a violin plot, whereas its performance in different stratification groups is depicted with a doughnut chart, with the centre representing the AUROC values. The horizontal white line inside each violin marks the mean of the distribution. Doughnuts marked with an asterisk at the top indicate statistically significant variation in results in the stratification analysis (Benjamini–Hochberg FDR-corrected P values from two-sided permutation testing \(P\ll 0.05\)). The percentage values at the bottom of the doughnut indicate the proportion of positive (MUT/high) or negative (WT/low) cases relative to the status of the stratification variables. Red and blue colours in each doughnut indicate the proportion of positive and negative cases in each stratified group concerning prediction variables. MUT, mutated; WT, wild-type.
These observations extend beyond colorectal tumours and are evident in biomarker predictors of breast and endometrial tumours, irrespective of the specific model architecture, feature embeddings or training methodology used. For instance, in breast tumours, the performance of the ER predictor substantially declines in cases with GATA3, CDH1 and PIK3CA mutations (Fig. 4). Likewise, the ER predictor’s AUROC drops substantially in both PR-positive and negative cases, as well as in TP53-mutant and wild-type cases. Similar trends are apparent for PR, TP53, CDH1 and PIK3CA predictors (Fig. 4). This trend of inconsistent subgroup performance is also observed for other single- and multi-output models, such as those utilizing TITAN WSI-level feature representation (Supplementary Figs. 5–7). For example, the AUROC of the ER predictor drops from 0.89 to 0.57 in single-output settings, whereas it drops from 0.88 to 0.58 under multi-output settings.
These results suggest that the biomarker prediction from ML models is contingent on the status of other interdependent biomarkers, and these models are probably relying on composite phenotypes arising from potentially interacting biomarkers rather than learning biomarker-specific morphology.
WSI-based biomarker prediction is confounded by histology grade
WSI-based models predict breast tumour receptor status (ER, PR) with high cohort-level AUROCs of 0.87 and 0.79 in the TCGA-BRCA cohort, and 0.90 and 0.78 in the ABCTB cohort, respectively. However, the stratification analysis by tumour grade reveals marked subgroup-level performance drops (Fig. 5). The ER predictor AUROC drops to 0.76 for medium-grade cases in both cohorts, and the PR predictor AUROCs in low and medium-grade cases drop to 0.59 and 0.69 in the TCGA-BRCA cohort and to 0.65 and 0.73 in the ABCTB cohort. Mutation predictors show similar grade-specific performance declines; for example, AUROC of the TP53 predictor drops from 0.81 (cohort-level) to 0.73, 0.73 and 0.72 for low-, medium- and high-grade cases. These patterns extend beyond breast tumours and are evident in the mutation predictors of endometrial tumours, irrespective of model architecture, feature embeddings or training methodology (Fig. 5 and Supplementary Fig. 8). For example, TP53 predictors trained on TITAN WSI-level embeddings also show performance drops in high-grade cases, with AUROCs decreasing from 0.83 to 0.77 in single-output settings and from 0.86 to 0.77 in multi-output settings.
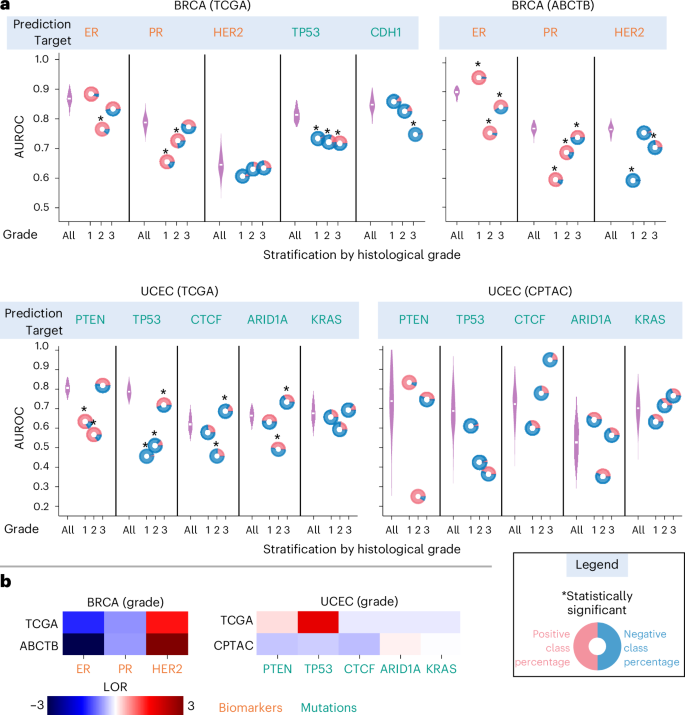
a, In the plots, AUROC values are illustrated on the y axis, with the top x axis indicating the prediction variables and the bottom x axis showing the patient stratification with respect to histological grade. The predictive performance of each predictor on all the cases in the cohort (denoted by ‘All’ in the plot) over 100 bootstrap runs is shown using a violin plot, whereas its performance in a group of patients with a certain histological grade is depicted with a doughnut chart, with the centre representing the AUROC values. The horizontal white line inside each violin marks the mean of the distribution. Doughnuts marked with an asterisk at the top indicate statistically significant differences in results (Benjamini–Hochberg FDR-corrected P values from two-sided permutation testing \(P\ll 0.05\)). Red and blue colours in each doughnut indicate the proportion of positive and negative cases in each stratified group in relation to prediction variables. b, Heat maps highlighting the shift in the association structure between histological grade and biomarker status across two distinct datasets. The colour intensity reflects the strength of association, with dark red indicating strong co-occurrence and dark blue indicating strong mutual exclusivity.
Our analysis further shows that the apparent AUROCs of WSI-based models are sensitive to shifts in biomarker-grade associations between training and test cohorts. For example, in high-grade UCEC cases, the TP53 predictor attains an AUROC of 0.70 in the TCGA cohort but only 0.36 in the CPTAC cohort, a pattern consistent with a shift in TP53-grade relationship from strong co-occurrence in the training cohort to moderate mutual exclusivity in the test cohort. Similarly, in low-grade cases, the ER predictor achieves an AUROC of 0.96 in the ABCTB cohort compared with a cross-validation AUROC of 0.90 in TCGA-BRCA, probably reflecting a stronger ER-grade association in ABCTB than in TCGA. Consistent with these, single- and multi-output models trained on TITAN WSI-level feature representations showed similar sensitivity (Supplementary Fig. 8). For example, in TCGA-UCEC, TP53 AUROC drops from 0.83 to 0.77 in high-grade cases for the single-output model and from 0.86 to 0.77 for the multi-output model. In CPTAC-UCEC, where the grade–mutation association differs, the drop in AUROC is more pronounced, from 0.61 to 0.53 for the single-output model and from 0.74 to 0.60 for the multi-output model.
The confounding influence of grade is further supported by experiments in which, for selected biomarkers, we trained separate models for grade 1, 2 and 3 patients; these grade-specific models attained lower AUROCs than the pooled model (Supplementary Table 1). For example, in TCGA-BRCA, the TP53 grade-specific predictors achieved AUROCs of ~0.73 compared with 0.84 for the pooled model, and ER and PR showed similar reductions. To evaluate whether these disparities could be attributed to demographic differences, we examined the demographic balance between biomarker-positive and biomarker-negative cases and found moderate racial differences (Supplementary Table 2). We therefore repeated the grade-stratified experiment only on patients in a single racial subgroup (white). The same trends persisted (Supplementary Table 3); for example, the ER predictor trained only on grade 1 cases achieved an AUROC of 0.66, substantially lower than the pooled AUROC of 0.85, suggesting that demographic factors are unlikely to drive these performance differences (Supplementary Table 3).
These results, reminiscent of Simpson’s paradox, indicate that WSI-based biomarker prediction models rely heavily on grade-associated morphology rather than biomarker-specific phenotypic signatures, making them less generalizable to external cohorts where grade–biomarker associations differ from those in the training data.
The added predictive power of biomarker predictors beyond pathologist grade assignments
Our analysis shows that the status of several biomarkers across cancer types can be inferred with accuracy higher than expected from pathologist-assigned grade, and in several cases, approaches the performance of deep learning models. In BRCA, grade-based ER and PR classifiers achieved AUROCs of 0.76 and 0.70 in the TCGA-BRCA cohort and 0.79 and 0.71 in the ABCTB cohort, respectively (Fig. 6). Grade also predicts TP53 mutations with an AUROC of 0.75, nearly matching the 0.81 achieved by weakly supervised ML models. Similar AUROC patterns were seen for TP53 and PTEN predictors in the TCGA-UCEC and CPTAC-UCEC cohorts. These results suggest that, for some biomarkers, ML algorithms offer limited additional predictive value over pathologist-assigned grade (Fig. 3). The strong grade–biomarker association also risks ML models linking grade-associated phenotypic differences to biomarker status; therefore, WSI-based models are expected to exceed this grade-derived baseline and establish robust phenotype–genotype associations that are independent of tumour grade.
The plots illustrate the AUROC achieved by a support vector machine classifier trained to predict a biomarker/gene mutation from one-hot encoded histological grades. Bar heights represent mean AUROC values, whereas error bars indicate the 95% confidence (two-sided, using Student’s t-distribution) calculated across 100 class-stratified bootstrap sampling runs. Bar labels are colour-coded, with yellow denoting biomarkers and green denoting mutations.
WSI-based biomarker prediction is confounded by the density of mutations in other genes
WSI-based models infer BRAF and TP53 mutations in colorectal tumours (TCGA-CRC) from WSIs with high confidence, achieving AUROCs 0.774 (0.764–0.785) and 0.717 (0.711–0.722), respectively (Fig. 7a). However, stratification analysis reveals a significant challenge: for cases with low mutation density in genes other than BRAF (denoted as \({\mathrm{TMB}}_{\widetilde{{BRAF}}}\)), the BRAF predictor accuracy drops to an AUROC of 0.65 (Fig. 7a). Similarly, the TP53 predictor AUROC drops to 0.50 for high TMB cases. In the CPTAC-CRC cohort, similar trends were observed, with BRAF and TP53 predictors’ performance dropping in low and high TMB cases, respectively. In addition, APC and KRAS mutation predictors are also influenced by TMB. This observation also extends to UCEC, where the PTEN predictor achieved AUROCs of 0.803 in TCGA-UCEC and 0.731 in CPTAC-UCEC but drops to 0.63 and 0.32 for low TMB cases in the respective cohorts (Fig. 7a).
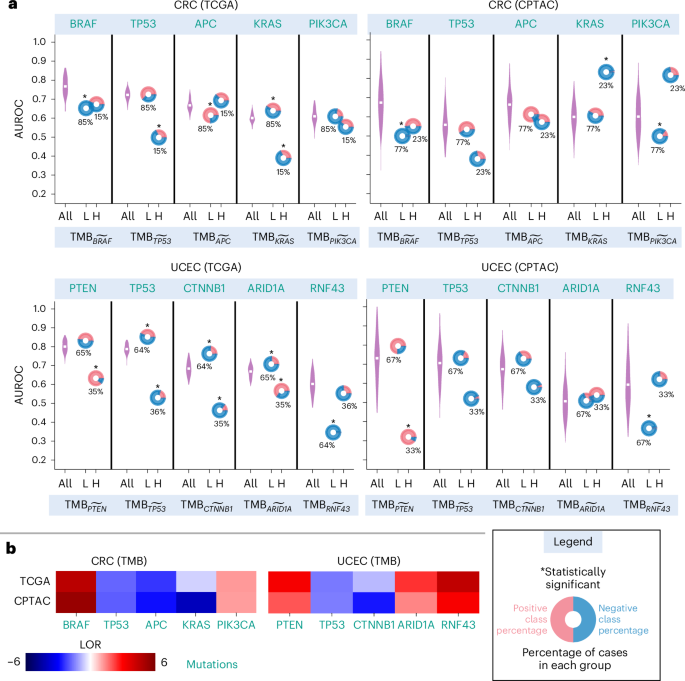
a, AUROC values are plotted on the y axis, with the top x axis indicating the prediction variables and the bottom x axis showing patients’ stratification with respect to TMB. The predictive performance of each predictor on all the cases in the cohort (denoted by ‘All’ in the plot) over 100 bootstrap runs is shown using a violin plot, whereas its performance in patients with high and low TMB is depicted with a doughnut chart, with the centre representing the AUROC values. The horizontal white line inside each violin marks the mean of the distribution. Doughnuts marked with an asterisk at the top indicate statistically significant variation in results (Benjamini–Hochberg FDR-corrected P values from two-sided permutation testing \(P\ll 0.05\)). Red and blue colours in each doughnut indicate the proportion of positive and negative cases in each stratified group based on prediction variables. b, Heat maps highlighting the shift in the association structure between TMB and gene mutations across two distinct datasets. The colour intensity reflects the strength of association, with dark red indicating strong co-occurrence and dark blue indicating strong mutual exclusivity.
We further show that varying associations between TMB and biomarker status across datasets significantly influence the prediction accuracy of WSI-based predictors. In CRC, the association between KRAS mutation and TMB is slightly stronger in the CPTAC-CRC cohort compared with the TCGA-CRC cohort (Fig. 7b). This stronger association could explain the KRAS predictor’s significantly improved prediction accuracy (AUROC: 0.83) in high TMB cases in the CPTAC-UCEC cohort, compared with an AUROC of 0.63 for high TMB cases in the TCGA-CRC cohort. This analysis suggests that the model’s predictions are not only influenced by the KRAS mutation status, which is the target prediction variable, but also by the overall TMB, which affects the prediction accuracy.
First Appeared on
Source link


Leave feedback about this